Browser Usage
VJSP provides advanced browser automation capabilities, allowing you to interact with websites directly from your IDE. This feature supports testing web applications, automating browser tasks, and capturing screenshots—all without leaving your development environment.
ⓘ Model Requirement
Browser usage in VJSP requires an advanced agent-capable model.
How Browser Usage Works
By default, VJSP uses a built-in browser that:
- Automatically launches when you ask VJSP to visit a website
- Captures screenshots of web pages
- Enables VJSP to interact with webpage elements
- Runs silently in the background
All of this happens directly within your IDE—no additional setup required.
Using the Browser
Typical browser interactions follow this pattern:
- Ask VJSP to visit a website
- VJSP launches the browser and shows you a screenshot
- Request additional actions (click, type, scroll)
- VJSP closes the browser when done
Examples:
Open the browser and check out our website.Can you verify that my site https://www.vjsp.net displays correctly?Browse http://localhost:3000, scroll to the bottom of the page, and check if the footer content renders properly?How Browser Actions Work
The browser_action tool controls a browser instance that returns a screenshot and console logs after every action, so you can see the results of each interaction.
Key characteristics:
- Each browser session must start with
launchand end withclose - Only one browser action is allowed per message
- No other tools can be used while the browser is active
- You must wait for the response (screenshot and logs) before issuing the next action
Available Browser Actions
| Action | Description | When to Use |
|---|---|---|
launch | Opens the specified URL in the browser | Start a new browser session |
click | Clicks at specific coordinates | Interact with buttons, links, etc. |
type | Types text into the currently focused element | Fill out forms, search boxes |
scroll_down | Scrolls down by one page | View content below the fold |
scroll_up | Scrolls up by one page | Return to previous content |
close | Closes the browser | End the browser session |
Browser Usage Configuration / Settings
ⓘ Default Browser Settings
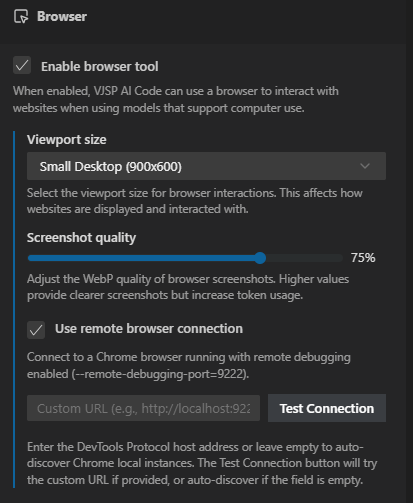
- Enable Browser Tool: Enabled
- Viewport Size: Small Desktop (900x600)
- Screenshot Quality: 75%
- Use Remote Browser Connection: Disabled
Accessing Settings
To change browser/computer usage settings in VJSP:
Click the gear icon ⚙️ → Browser/Computer Usage to open settings
Enable/Disable Browser Usage
Purpose: Main toggle that allows VJSP to interact with websites using a Puppeteer-controlled browser.
To change this setting:
Check or uncheck the "Enable Browser Tool" checkbox in the Browser/Computer Usage settings

Viewport Size
Purpose: Determines the resolution of the browser session used by VJSP.
Trade-off: Higher values provide a larger viewport but increase token usage.
To change this setting:
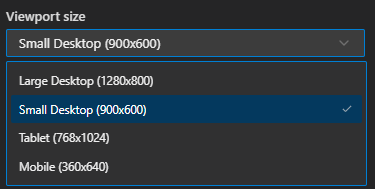
- Click the dropdown under "Viewport Size" in the Browser/Computer Usage settings
- Select one of the available options:
- Large Desktop (1280x800)
- Small Desktop (900x600) – default
- Tablet (768x1024)
- Mobile (360x640)
- Choose your desired resolution.
Screenshot Quality
Purpose: Controls WebP compression quality for browser screenshots.
Trade-off: Higher values yield sharper screenshots but increase token usage.
To change this setting:
- Adjust the slider under "Screenshot Quality" in the Browser/Computer Usage settings
- Set a value between 1–100% (default is 75%)
- Higher values produce clearer screenshots at the cost of higher token consumption:
- 40–50%: Suitable for basic text-based sites
- 60–70%: Good for most general browsing
- 80%+: Use when fine visual detail is critical

Remote Browser Connection
Purpose: Connects VJSP to an existing Chrome browser instead of using the built-in one.
Benefits:
- Works in containerized environments and remote development workflows
- Maintains authenticated sessions across browser usages
- Eliminates repetitive login steps
- Allows use of custom browser profiles with specific extensions
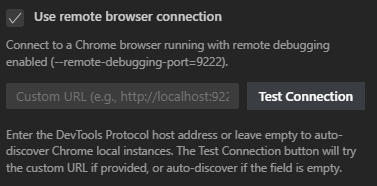
Requirement: Chrome must be running with remote debugging enabled.
To enable this feature:
- Check the "Use Remote Browser Connection" box in the Browser/Computer Usage settings
- Click "Test Connection" to verify
Common Use Cases
- DevContainers: Connect from a containerized VS Code to a host Chrome browser
- Remote Development: Use local Chrome with a remote VS Code server
- Custom Chrome Profiles: Leverage profiles with specific extensions and settings
Connecting to a Visible Chrome Window
Connect to a visible Chrome window to observe VJSP’s interactions in real time:
macOS
/Applications/Google\ Chrome.app/Contents/MacOS/Google\ Chrome --remote-debugging-port=9222 --user-data-dir=/tmp/chrome-debug --no-first-runWindows
"C:\Program Files\Google\Chrome\Application\chrome.exe" --remote-debugging-port=9222 --user-data-dir=C:\chrome-debug --no-first-runLinux
google-chrome --remote-debugging-port=9222 --user-data-dir=/tmp/chrome-debug --no-first-run